
Lesson: Graphing with Limits
By: The Axioma Scholar Team

In calculus, a limit describes what value a function approaches as the input gets closer and closer to a certain number.
Graphs make limits much easier to understand because we can visually see what the function is approaching.
In this lesson, we will learn how to read limits from graphs, including:
- How to estimate a limit from a graph
- What left-hand and right-hand limits mean
- What it means when a limit exists
- What it means when a limit does not exist
- How holes, jumps, and vertical asymptotes affect limits
1. What Does a Limit Look Like on a Graph?
When we write:
$$ \lim_{x \to a} f(x)=L $$
we are asking:
“As $x$ gets closer and closer to $a$, what value does $f(x)$ get closer and closer to?”
On a graph, this means we look at the curve from both sides and see what $y$-value the graph approaches.
The important idea is:
A limit is about what the graph approaches, not always what the graph equals.
Example 1: A Simple Limit
Look at the function:
$$ f(x)=x+1 $$
We want to understand:
$$ \lim_{x \to 2} (x+1) $$
If $x$ gets closer and closer to $2$, then $x+1$ gets closer and closer to $3$.
So:
$$ \lim_{x \to 2} (x+1)=3 $$
 Basic limit
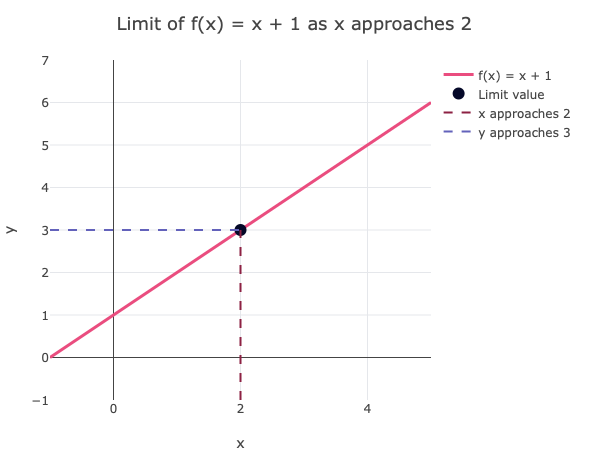
In the graph above, as $x$ approaches $2$, the graph approaches the height $y=3$.
This is true from both sides:
- From the left side of $x=2$, the graph approaches $3$.
- From the right side of $x=2$, the graph also approaches $3$.
Since both sides approach the same value, the limit exists.
2. Left-Hand and Right-Hand Limits
Sometimes we only look at one side of the graph.
A left-hand limit looks like this:
$$ \lim_{x \to a^-} f(x) $$
This means we approach $a$ from values less than $a$.
A right-hand limit looks like this:
$$ \lim_{x \to a^+} f(x) $$
This means we approach $a$ from values greater than $a$.
For the regular two-sided limit to exist:
$$ \lim_{x \to a} f(x) $$
the left-hand limit and right-hand limit must be equal.
In other words:
$$ \lim_{x \to a^-} f(x)=\lim_{x \to a^+} f(x) $$
Example 2: A Limit That Exists
Suppose the graph approaches the same $y$-value from both sides.
For example, consider:
$$ f(x)=x^2 $$
We want:
$$ \lim_{x \to 2} x^2 $$
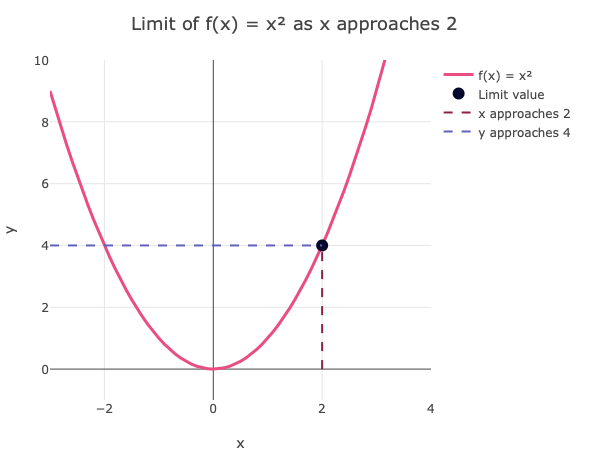
As $x$ approaches $2$ from the left, $x^2$ approaches $4$.
$$ \lim_{x \to 2^-} x^2=4 $$
As $x$ approaches $2$ from the right, $x^2$ also approaches $4$.
$$ \lim_{x \to 2^+} x^2=4 $$
Since both one-sided limits are equal:
$$ \lim_{x \to 2} x^2=4 $$
3. Reading Limits from a Graph
To read a limit from a graph, follow this process:
- Find the $x$-value that $x$ is approaching.
- Look at the graph from the left side of that $x$-value.
- Look at the graph from the right side of that $x$-value.
- Ask whether both sides approach the same $y$-value.
- If they do, that $y$-value is the limit.
- If they do not, the limit does not exist.
The actual value of the function at that point is not always the same as the limit.
4. Holes in Graphs
A hole in a graph means the function is missing a value at one point.
However, the limit can still exist.
For example:
$$ f(x)=\frac{x^2-4}{x-2} $$
This function is undefined at $x=2$, because the denominator becomes zero:
$$ x-2=0 $$
But we can simplify the expression:
$$ \frac{x^2-4}{x-2} = \frac{(x-2)(x+2)}{x-2} $$
For $x \neq 2$, this simplifies to:
$$ f(x)=x+2 $$
So the graph behaves like the line $y=x+2$, except there is a hole at $x=2$.
As $x$ approaches $2$, the graph approaches:
$$ 2+2=4 $$
Therefore:
$$ \lim_{x \to 2} \frac{x^2-4}{x-2}=4 $$
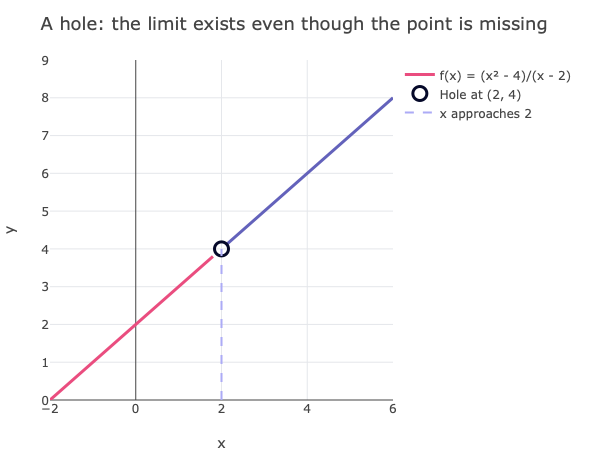
Notice that the graph has a hole at $x=2$, but the curve still approaches $y=4$.
This shows an important idea:
A function does not need to be defined at a point for the limit to exist.
5. When the Function Value Is Different from the Limit
Sometimes a graph approaches one value, but the actual function value is somewhere else.
Imagine the graph approaches $y=4$ as $x$ approaches $2$, but the function has a filled point at $y=1$.
In that case:
$$ \lim_{x \to 2} f(x)=4 $$
but:
$$ f(2)=1 $$
The limit is still $4$, because limits care about what happens near the point, not necessarily at the point.
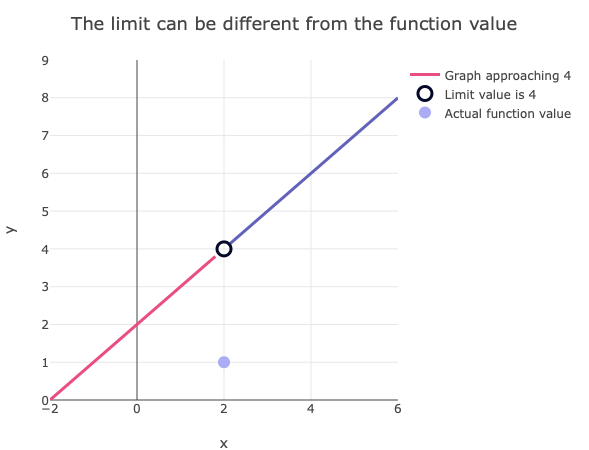
In the graph above, the open circle shows the value the graph approaches.
The filled dot shows the actual value of the function at $x=2$.
Since the graph approaches $4$ from both sides:
$$ \lim_{x \to 2} f(x)=4 $$
But since the filled dot is at $y=1$:
$$ f(2)=1 $$
6. Jump Discontinuities
A jump discontinuity happens when the graph jumps from one height to another.
In this case, the left-hand limit and right-hand limit are different.
For example, suppose:
$$ f(x)= \begin{cases} 2, & x<1 \ 5, & x>1 \end{cases} $$
As $x$ approaches $1$ from the left, the function approaches $2$:
$$ \lim_{x \to 1^-} f(x)=2 $$
As $x$ approaches $1$ from the right, the function approaches $5$:
$$ \lim_{x \to 1^+} f(x)=5 $$
Since $2\neq 5$, the two-sided limit does not exist.
Therefore:
$$ \lim_{x \to 1} f(x) \text{ does not exist} $$
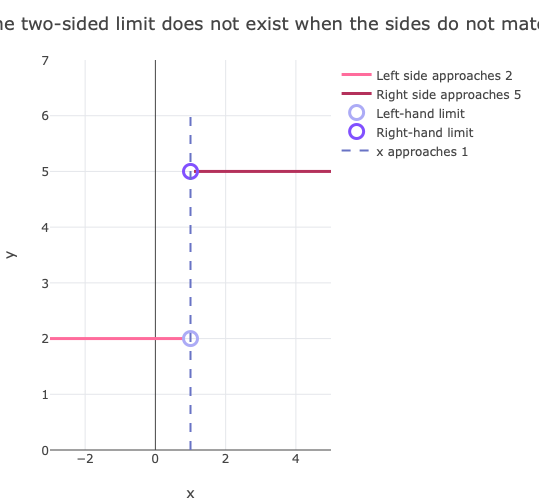
The graph approaches one value from the left and a different value from the right.
When this happens, the two-sided limit does not exist.
7. Vertical Asymptotes
A vertical asymptote happens when the graph goes upward or downward without bound near a certain $x$-value.
For example, consider:
$$ f(x)=\frac{1}{x} $$
We want to understand what happens as $x$ approaches $0$.
As $x$ approaches $0$ from the right, the graph goes upward:
$$ \lim_{x \to 0^+} \frac{1}{x}=\infty $$
As $x$ approaches $0$ from the left, the graph goes downward:
$$ \lim_{x \to 0^-} \frac{1}{x}=-\infty $$
Since the left-hand and right-hand behavior is different, the two-sided limit does not exist.
So:
$$ \lim_{x \to 0} \frac{1}{x} \text{ does not exist} $$
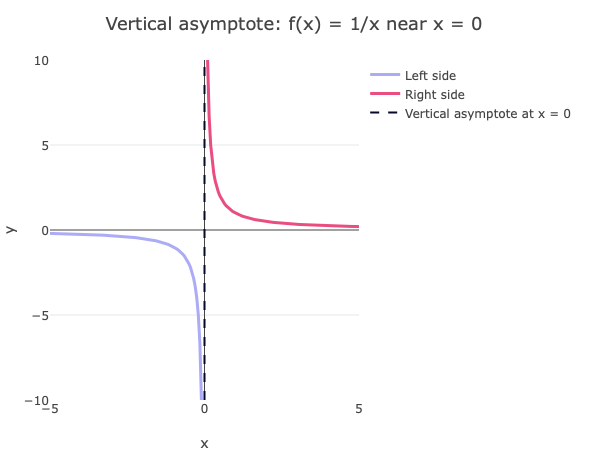
A vertical asymptote often means the function is becoming very large or very negative near a certain $x$-value.
This is different from a hole.
- A hole means the graph approaches a specific height, but the point is missing.
- A vertical asymptote means the graph does not settle near one specific height.
8. Removable vs. Non-Removable Discontinuities
A discontinuity is a break in a graph.
Some discontinuities are removable, and some are not.
Removable Discontinuity
A removable discontinuity usually looks like a hole.
The limit exists, but the function is either undefined or has the wrong value at that point.
Example:
$$ \lim_{x \to 2} \frac{x^2-4}{x-2}=4 $$
The graph has a hole at $x=2$, but the limit exists.
Non-Removable Discontinuity
A non-removable discontinuity cannot be fixed by simply filling in one missing point.
Examples include:
- Jump discontinuities
- Vertical asymptotes
In these cases, the two-sided limit usually does not exist.
9. How to Decide if a Limit Exists from a Graph
When you are given a graph, ask yourself these questions:
- What $x$-value am I approaching?
- What $y$-value does the graph approach from the left?
- What $y$-value does the graph approach from the right?
- Are those two $y$-values the same?
If the left side and right side approach the same value, the limit exists.
If they approach different values, the limit does not exist.
Symbolically:
$$ \lim_{x \to a} f(x) \text{ exists if and only if } \lim_{x \to a^-} f(x)=\lim_{x \to a^+} f(x) $$
10. Summary Table
11. Practice Reading Limits from Graphs
Practice Example 1
Suppose a graph approaches $y=6$ from the left and $y=6$ from the right as $x$ approaches $3$.
Then:
$$ \lim_{x \to 3^-} f(x)=6 $$
and:
$$ \lim_{x \to 3^+} f(x)=6 $$
Since both sides match:
$$ \lim_{x \to 3} f(x)=6 $$
Practice Example 2
Suppose a graph approaches $y=2$ from the left and $y=7$ from the right as $x$ approaches $4$.
Then:
$$ \lim_{x \to 4^-} f(x)=2 $$
and:
$$ \lim_{x \to 4^+} f(x)=7 $$
Since the two sides are not equal:
$$ \lim_{x \to 4} f(x) \text{ does not exist} $$
Practice Example 3
Suppose a graph has a hole at $(5,8)$, but the graph approaches that hole from both sides.
Then:
$$ \lim_{x \to 5} f(x)=8 $$
The function might not be defined at $x=5$, but the limit still exists.
12. Final Key Idea
When using graphs to understand limits, remember:
The limit is the $y$-value the graph approaches as $x$ gets close to a certain value.
The graph does not need to actually touch that point.
The graph does not even need to be defined at that point.
What matters is what the graph is approaching from the left and from the right.
Ready to practice?

Turn this lesson into real progress with adaptive practice that responds to how you're learning and helps guide you toward mastery.